Ways Florida Growers Are Mapping out Solutions With Technology
In its most basic form, a map can tell you how to get where you want to go. Likewise, layering data on maps can help you track soil fertility, input applications, irrigation, soil moisture, and much more. Over time, these data can help you make more informed decisions about your farming practices in each of your fields.
How Field Mapping Works
Jones Potato Farm’s Alan Jones, who grows potatoes and green beans in Parrish, FL, uses field mapping to improve fertilizer application efficiency, with an eye toward stewardship. Jones’ crews take soil samples using GPS to create the fertility maps that direct variable-rate applications.
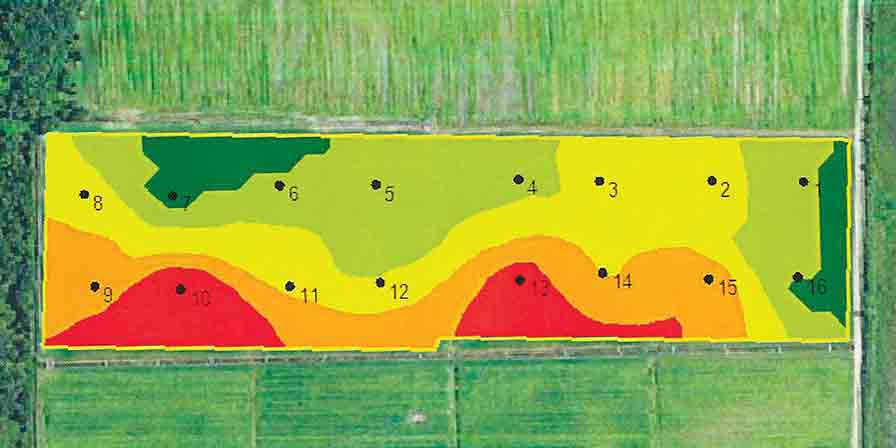
“We pull one sample per every 2 acres in a field,” Jones says. “For example, we have one 51-acre field that we pull 24 samples from. We are not only monitoring for soil pH, we are mapping our soil-based cation exchange capacities (CEC). Just in this one field, the CEC ranges from 3 to 10.2. We also are monitoring for magnesium, calcium, and phosphorus. Does every acre in that field need the same amount of fertilizer? No.”

Potato and green bean grower Alan Jones uses field mapping technology to pull soil samples on grids to create a more extensive look at where inputs are needed or not needed. In this 51-acre field, he pulled 24 samples to determine lime recommendations.
The CEC ratings play an important role in dictating how much fertilizer is applied in certain parts of the field.
Jones says a CEC range between 4 and 6 is considered a normal soil type. Anything over a 6 is considered a heavier soil type, which requires less fertilizer. Meanwhile, soils with lower CEC ranges have less holding capacity, thus requiring more fertilizer.
“If we look at our lime applications, we give the spreader truck driver a thumb drive he plugs into the controller, and his application rate will change automatically as he drives through the field based on what the need is according to the map,” Jones says.
In the 51-acre field, the lime requirement ranges from 900 pounds per acre to 3,000 pounds per acre, Jones says. His crews are able to apply only the amount of lime needed for the field.
“You could not do this if you were pulling only one sample every 20 acres in that field,” he says.
In addition to variably applying lime, Jones applies his final application (third) of fertilizer using variable-rate technology and backs off rates to improve efficiency of applications.
“With the data we are building on the farm, the final piece will be to add yield monitors, so we can lay that information over our fertility maps to see what we are actually doing to improve and/or balance out yields,” Jones says. “It may take five to 10 years of doing this to achieve the full benefits of all of this data collection and variable-rate applications. We hope to eventually take out some of the variability in the soil and even it out a bit.”

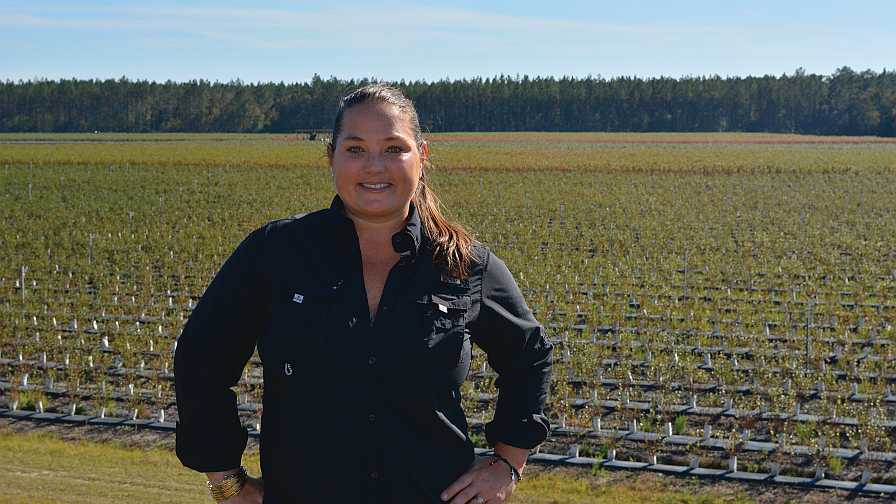
Blueberry grower Brittany Lee makes extensive use of data to map out zones in her fields for irrigation and fertilizer applications.
Photo by Frank Giles
How Irrigation Mapping Works
Mapping can be extended beyond dry fertilizer to irrigation and fertigation. Brittany Lee, a blueberry grower based in Waldo, FL, has deployed weather stations and soil moisture monitoring technology on her farm to maximize water and fertilizer resources. In fact, her stewardship earned her the 2017 Agricultural Environmental Leadership Award — an honor given by the Florida Department of Agriculture.
Lee is a believer in collecting data to make sound production decisions.
“We kind of geek out on data here and love knowing all the data points,” she says. “We collect a lot of information from 16 weather stations placed around the farm.”
The stations connect to Lee’s Netafim NMC PRO irrigation control panel. The system is connected via Wi-Fi or cell, so she can access it and take action from anywhere with a signal. Most of the fertilizer is fed to her blueberries via drip fertigation.
Lee uses a service from Highland Precision Ag to organize the data she collects on the farm. The service provides scheduled soil and leaf tissue nutrition tests and a software platform that shows visual maps of each field.
 “We have a lot of data, so if you ask me what the soil and leaf samples are in a particular field or zone, I could look that up and tell you,” Lee says.
The Highland platform makes it much easier to pull that information and track it with a more visual, map-based layout, she says.
In each field, she and her team run tests per irrigation zone and per variety.
“If we have five varieties in one irrigation zone, I want to know what those varieties are receiving in terms of nutrients and how they are performing,” Lee says. “Maybe one variety retains boron better. If that is the case, we can make applications specific to the needs of the variety rather than just broadcasting across the field. All the technologies we have invested in on the farm allow us to do that.


